Welcome to Uxdisplay Institute, Mentoring you with Management Training

Power Bi Course
Join our comprehensive Power BI Course at UX Display Institute and transform your data
into actionable insights.
- Transform your data into insightful visualizations and reports.
- Learn to create interactive dashboards that drive decision-making.
- Master essential Power BI tools and techniques for data analysis.
About the Course
The Power BI course at UX Display Institute is designed to equip you with the skills to analyze and visualize data effectively. Power BI is a powerful business analytics tool that allows users to transform raw data into insightful visual reports and dashboards. In this course, you will learn how to connect to various data sources, clean and shape data, create visualizations, and build interactive reports. You’ll also explore advanced features like DAX formulas and Power Query to enhance your data manipulation and analysis skills. Whether you are a beginner or looking to enhance your existing skills, this course provides practical, hands-on learning to help you harness the full potential of Power BI for data-driven decision-making.
Power Bi Course
Advance Power Bi Course
Power Bi Course + Practical Traning2 Month
-
100% Job Placement
-
80 + Modules
-
Certification
-
1 hrs / day
Master Power Bi Course
Power Bi Course + Practical Traning + Interview Traning3 Month
-
100% Job Placement
-
100 + Modules
-
Certification
-
1 hrs / day
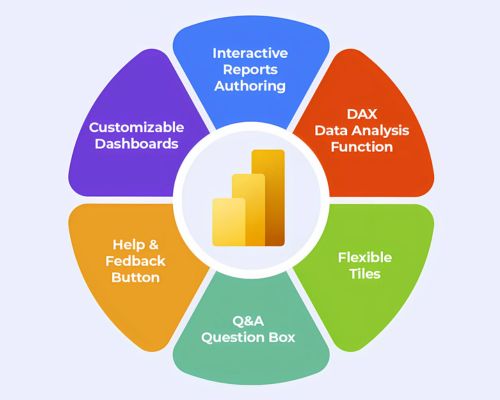
Key Skills You’ll Gain
Gain essential skills in data connection, transformation, modeling, visualization, and dashboard creation
using Power BI for impactful insights.
Introduction to Power BI
Understand the basics of Power BI and its components, including Power BI Desktop, Service, and Mobile.
Data Connection
Learn how to connect Power BI to various data sources, such as Excel, SQL Server, and cloud-based services.
Data Transformation
Master Power Query to clean, reshape, and transform your data for analysis.
Data Modeling
Create data models using relationships and data types to prepare your data for reporting.
Advanced Excel Tools
Explore Data Analysis Expressions (DAX) to perform calculations and create custom measures.
Creating Visualizations
Design interactive and insightful visualizations, including charts, graphs, and maps.
Why Choose UX Display Institute for the Power Bi Course?
Choosing UX Display Institute for your Power BI course means investing in a comprehensive learning experience that combines practical skills with industry insights. Our expert instructors bring years of experience in data analytics and business intelligence, ensuring you receive the highest quality education. We emphasize hands-on learning, providing real-world projects that allow you to apply your knowledge immediately.
At UX Display Institute, we understand the importance of staying updated with the latest trends in data visualization and analytics. Our curriculum is regularly updated to reflect current industry practices, equipping you with the most relevant skills sought by employers.
Additionally, our supportive learning environment fosters collaboration and networking opportunities with fellow students and professionals. You’ll have access to a wealth of resources, including webinars, workshops, and one-on-one mentorship, to enhance your learning journey.
By choosing UX Display Institute, you’re not just enrolling in a course; you’re joining a community dedicated to your success in the data analytics field. Let us help you unlock your potential and become a proficient Power BI professional ready to tackle today’s data challenges.
Key Features of the Course
Comprehensive Training, Hands-On Projects, Expert Instructors, Flexible Learning, Certification, Career Support,
Latest Tools, and Real-World Applications!
Practical, hands-on training
Access to recorded lectures
Affordable fees and installment options
Certification upon completion
Course Modules for Power BI Course
This structured approach ensures that students gain a thorough understanding of Power BI and its capabilities,
preparing them for practical application in the business intelligence field.
Introduction to Power BI
- Overview of Power BI and its components
- Understanding the Power BI ecosystem
- Installing and configuring Power BI Desktop
Getting Started with Power BI
- Navigating the Power BI interface
- Connecting to various data sources (Excel, SQL Server, etc.)
- Importing and transforming data using Power Query
Data Modeling
- Creating relationships between tables
- Understanding data types and data normalization
- Building a star schema for efficient reporting
Data Visualization Techniques
- Designing effective visualizations
- Utilizing different chart types and when to use them
- Customizing visualizations for better insights
Creating Dashboards and Reports
- Designing interactive reports using Power BI
- Implementing filters and slicers for dynamic reporting
- Sharing and publishing reports to the Power BI service
What Our Students Say
Include testimonials from past students about how the course helped them achieve their goals. Use photos and names (with permission) for authenticity.


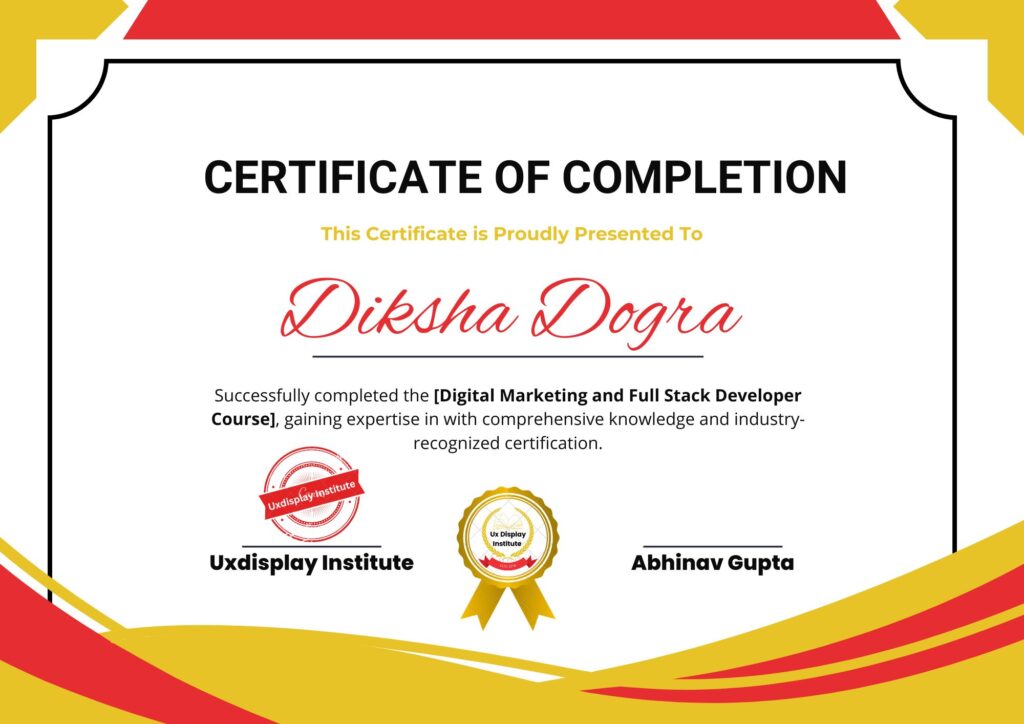

Earn a Recognized Certification
Successfully completed the [Course Name], earning certification in [Key Skill/Field] with a focus on practical application and industry relevance. This comprehensive program covered essential topics such as [Specific Topics] and equipped participants with in-demand skills like [High-Demand Skill/Technology]. Designed to enhance career growth, the course provided hands-on experience and expert guidance, ensuring mastery of [Specific Field/Skill]. Recognized for its high-quality curriculum, this certification validates proficiency and prepares individuals for success in competitive industries. Certified graduates are now equipped to excel in [Industry/Field], showcasing their expertise and commitment to professional development in [Key Skill/Field].
Book Your Course Today and Started Your Career Journey
Looking For More Information
FAQs for Power BI Course
Find Answers About Course Duration, Certification, Learning Formats, Placement Assistance,
and More to Support Your Decision!
What is Power BI?
Power BI is a business analytics tool by Microsoft that enables users to visualize data, share insights, and make data-driven decisions. It transforms raw data into interactive dashboards and reports.
Who is this course suitable for?
This course is ideal for beginners as well as professionals looking to enhance their data analysis skills. It is beneficial for data analysts, business analysts, and anyone interested in making data-driven decisions.
What prior knowledge do I need?
No prior knowledge of Power BI is required, but a basic understanding of data concepts and familiarity with Excel can be helpful.
How long is the course?
The course typically spans several weeks, with flexible scheduling options to accommodate various learning paces.
Will I receive a certificate upon completion?
Yes, participants will receive a certificate of completion after successfully finishing the course, which can be added to your resume or LinkedIn profile.
Are there any hands-on projects?
Absolutely! The course includes hands-on projects and real-world case studies to help you apply your learning in practical scenarios.

Courses
Computer Course
Advance Excel Course
Computer Hardware and Networking Course
Content Writing Course
Tally Course
Typing Course
English Speaking Course (IELTS/PTE/TOEFL/DUOLINGO )
Courses
Digital Marketing Course
Seo Course
Graphic Designing Course
Ui Ux Design Course
Video Editing Course
Full Stack Developer Course
App Development Course
Devops Course
Java Course
Courses
Prompt Engineering Course
Software Testing Course
Sql Course
Web Development Course
Cloud Computing Course
Aws Course
Data Science Course
Ai Course
Artificial Intelligence Course
Courses
Computer Science Course
Generative Ai Course
Machine Learning Course
Python Course
Data Analytics Course
Power Bi Course
Tableau Course
Cyber Security Course
Hacking Course
Sap Course